Energy price movements in the UK remain under close scrutiny as households face another expected rise in the Ofgem price cap. Consumer finance commentator Martin Lewis has highlighted a common misunderstanding in how changes to the cap are reported, warning that headline figures such as a “£200 increase” can be misleading when taken out of context.
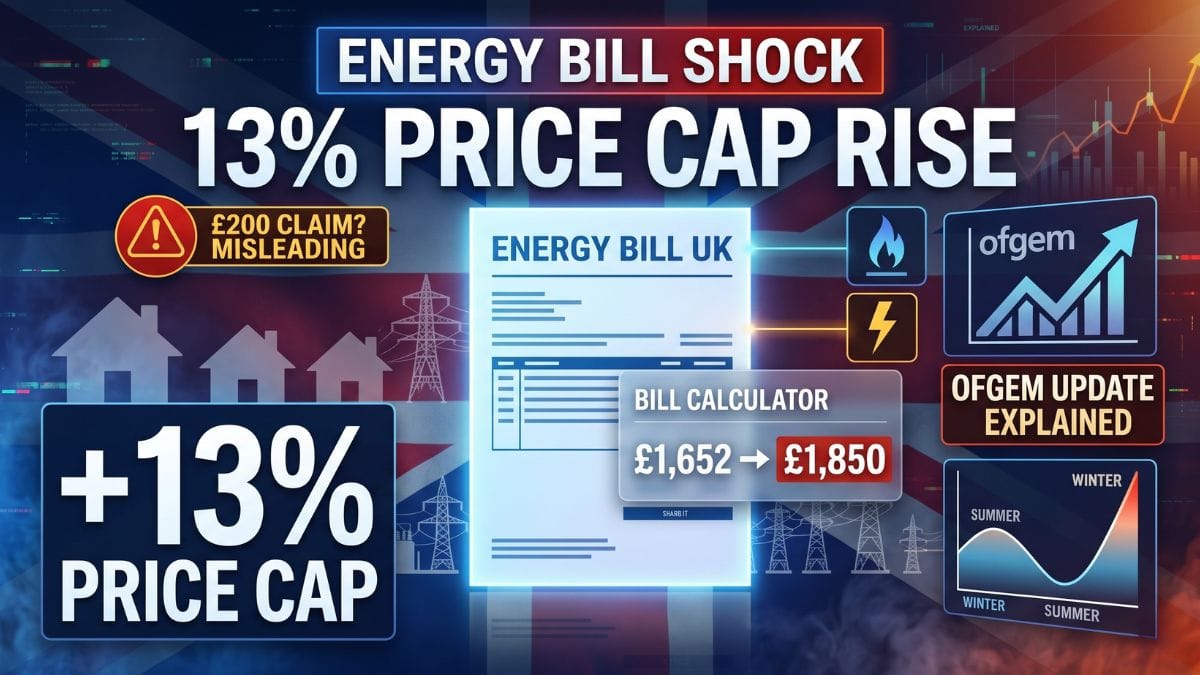
Industry forecasts suggest the Ofgem energy price cap could rise by around 13% for the July to September 2026 quarter. This projection reflects ongoing volatility in global energy markets, including geopolitical tensions affecting natural gas supply chains.
However, the way this change is communicated often leads to confusion. Martin Lewis has stressed that referencing a single annual figure, such as a £200 increase, does not accurately reflect how the price cap operates in practice.
The price cap is reviewed quarterly and applies to unit rates, not fixed annual bills. This means the real-world impact depends on usage patterns and the time of year, rather than a simple yearly increase applied uniformly to all households.
Mechanism
The energy price cap is set by Ofgem and limits the maximum amount suppliers can charge per unit of gas and electricity for a typical household. It does not cap total bills directly. Instead, final costs depend on how much energy is used.
This structure means that changes in the cap are translated into estimated annual costs based on “typical consumption.” Analysts often use this model to communicate expected bill changes, but it can oversimplify how households are affected.
Cornwall Insights has estimated that average annual bills could rise from around £1,652 to approximately £1,850 under the latest forecast. While this suggests a notable increase in headline terms, the timing and seasonal usage patterns significantly affect actual short-term impact.
Timing
A key point raised is that the price cap applies over a three-month period, not a full year at a time. This distinction is central to understanding why annualized figures can be misleading.
Energy usage is also not evenly distributed throughout the year. Households typically consume a much larger share of energy during colder months for heating. In contrast, summer consumption is significantly lower, meaning price changes in July to September affect a smaller portion of annual usage.
Martin Lewis explained that roughly 15% of annual energy use occurs during the summer quarter. As a result, a percentage increase in the cap does not translate into a proportional increase in yearly bills.
Impact
To illustrate the practical effect, consider a household spending around £150 per month on energy. A 13% increase in the price cap would not add £200 to annual costs in that quarter alone.
Instead, the estimated impact over the three-month period would be closer to £30 to £40 in additional costs for a typical household. This reflects both the seasonal reduction in usage and the fact that the cap adjustment applies only to that specific period.
While this still represents a rise in expenses, it is materially different from simplified annual figures often cited in headlines.
Forecast
Looking beyond the July quarter, analysts expect further adjustments to the price cap, although forecasts remain uncertain due to global energy market conditions.
Current projections suggest:
- Around a 4.5% increase in October 2026
- Around a 0.6% increase in January 2027
These estimates are subject to change depending on global gas supply dynamics, geopolitical developments, and infrastructure risks affecting major energy producers.
Natural gas remains the primary driver of UK energy pricing, meaning even relatively small disruptions in supply can influence domestic bills.
Context
Martin Lewis noted that even if geopolitical tensions ease quickly, the effects on energy pricing may not be immediate. Infrastructure constraints and supply chain disruptions can continue to influence prices after conflicts or shocks subside.
This lag effect means that price reductions, if they occur, may take several months to feed through into household bills. In some scenarios, prices may not return to previous levels until later price cap periods.
He also highlighted that current market conditions are still far removed from earlier peaks seen during major energy crises, although volatility remains a key feature of the market.
Interpretation
The central issue raised is not the direction of energy prices alone, but how they are communicated to the public. Annualized headline figures can create the impression of sudden, uniform cost increases, when in reality the impact is phased, seasonal, and dependent on consumption.
Knowing how the price cap works helps clarify why a forecast percentage rise does not directly translate into a simple yearly bill increase. Instead, it affects unit pricing over a defined period, which then filters through household usage patterns.
For consumers, the practical takeaway is that energy costs remain sensitive to global events, but the short-term impact of quarterly price changes is often smaller and more variable than headline figures suggest.
The Ofgem price cap system determines the maximum cost of energy per unit, not a fixed annual bill, meaning changes in the cap must be interpreted through usage and timing. While forecasts point to a 13% rise for the July to September 2026 period, the actual impact on household budgets is more modest over that quarter than annualized figures imply. The broader outlook remains uncertain, with further adjustments expected later in the year depending on global energy market conditions.
FAQs
Does a 13% price cap rise mean bills go up £200?
No, the impact depends on usage and only applies over a quarter.
How often is the energy price cap updated?
It is reviewed and adjusted every three months by Ofgem.
Does the price cap limit total bills?
No, it limits unit rates, not total household bills.
Why do energy bills vary seasonally?
Households use more energy in winter than in summer.